The Google HEART Framework: Your Guide to Measuring User-Centric Success
How to apply Happiness, Engagement, Adoption, Retention, and Task Success metrics to build better products.
In product-led growth, user experience is key. But how do you measure something as subjective as “user satisfaction”?
Google’s HEART framework helps with this.
Created by Google’s UX research team, HEART stands for Happiness, Engagement, Adoption, Retention, and Task Success. It’s a simple way to track your product's user experience (UX).
In this post, we break down each HEART element with practical tips, examples, and a Google Maps Case Study.
Before we go further, remember that data is only helpful if it leads to better decisions. Instead of tracking everything, focus on a few key metrics that align with your strategy and objectives.
Let’s dive into the details.
1. Happiness
Definition: The user’s attitude or satisfaction. This is subjective and often measured with surveys or in-app feedback.
Example: For a SaaS platform, you might send a quick survey after users complete a key milestone. High satisfaction scores usually predict strong word-of-mouth.
My advice: Track changes in Happiness alongside other metrics. A short-term dip in sentiment might not be critical, but a long-term decline signals deeper problems.
2. Engagement
Definition: How often and how deeply users interact with your product.
Example: On a streaming platform, total watch time or daily viewing sessions can measure Engagement. In a collaboration tool, it might be the number of documents created per week.
My advice: Focus on meaningful Engagement. Increasing time spent on a page isn’t always good if it means users are confused or stuck. Tie Engagement to real value for both users and the business.
3. Adoption
Definition: The number of new users (or customers) over time. This can also mean how quickly users embrace new features.
Example: If you offer a free trial, track how many sign-ups convert to paying customers. For product-led growth, measure Time to Value (TTV) - the time before users experience your product’s core benefit.
My advice: Reduce friction in onboarding. Make it easier for users to reach value quickly. If new users see the benefit fast (the “Aha moment”), they’ll be more likely to stay.
4. Retention
Definition: How well your product keeps users over time. A “sticky” product means users return regularly.
Example: If 200 people sign up in January, how many still use your product by March? If 120 remain active, your retention is 60%.
My advice: Retention often follows Happiness. If satisfaction drops, churn might rise soon after. Keep users engaged by delivering real value, not just short-term hacks. (For example, LinkedIn once introduced games to “prep your mind for the workday.”)
5. Task Success
Definition: Measures how effectively users complete specific tasks. This includes efficiency (time to complete), effectiveness (tasks completed), and error rate.
Example: If you’re testing a new feature, assign a task, like creating a project, and see how many users finish without errors. Compare results to a benchmark or competitor’s product.
My advice: You can run remote usability tests at scale, e.g., using Maze. Pair Task Success metrics with qualitative insights, such as user interviews, to understand Why users fail.
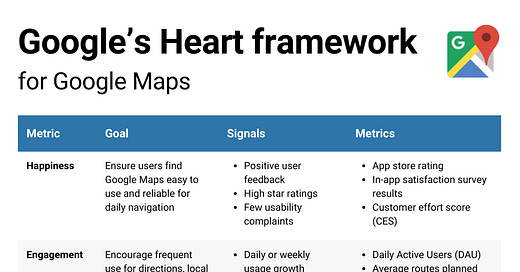
Case Study: Google’s Heart Framework for Google Maps
An example of Google Heart Framework (my analysis):
How to Implement the HEART Framework (3 Steps)
Here’s how to implement the Google HEART Framework in practice:
Step 1: Goals
Identify your product or feature goals. What are the desired outcomes? Are you improving onboarding, reducing churn, or boosting user satisfaction?
Step 2: Signals
Determine which user actions indicate success or failure for each goal. Failures, like incomplete tasks, are often easier to identify than successes.
Step 3: Metrics
Map these signals to specific HEART metrics. For example, if your goal is faster onboarding, track setup completion time (Task Success) or first-time user satisfaction (Happiness).
When Google’s teams use HEART, they get user-centric, data-informed insights. You can do the same. Just adjust these metrics to your product and audience.
FAQ
Q: Who created the Google HEART framework?
A: Google’s UX research team (led by Kerry Rodden, Hilary Hutchinson, and Xin Fu) created HEART to measure user satisfaction and product success.
Q: Is the HEART framework only for UX teams?
A: No. Product managers, designers, and engineers can all use HEART metrics to drive user-centric decisions.
Q: Do I need all five HEART metrics at once?
A: Not necessarily. Focus on the metrics that match your immediate goals. You can add more over time.
Q: How do I collect Happiness data?
A: Surveys (Customer Satisfaction - CSAT, Customer Effort Score - CES), often as in-app polls, can all measure user satisfaction. Combine them with other metrics for context.
Q: Can I benchmark Task Success against competitors?
A: Absolutely! Running usability tests on both products can show where you excel and where you might be behind.
Liked this?
You might also enjoy:

