How to Prioritize Ideas as a Product Manager?
How to assess customer and business value: Product Backlog prioritization frameworks and common sense.
Welcome to this week's special premium edition of The Product Compass. I'm Paweł, and every week, I share actionable tips and resources for PMs. Consider subscribing and upgrading your account if you haven’t already for the full experience:
One of the common questions I get asked in our private Slack involves prioritizing ideas in the Product Backlog.
No wonder. Your main goal as a Product Manager is maximizing the value for your customers and the business.
So, in today’s newsletter, I want to dive deeper:
How to Assess Value for the Customers
🔒 How to Assess Value for the Business
🔒 My Opinion About WSJF Product Backlog Prioritization
🔒 A Recommended Prioritization Framework
🔒 Summary
1. How to Assess Value for the Customers
Let's dive into our first crucial element: assessing customer value (aka Opportunity Score). There are two popular ways of doing this.
1.1 Opportunity Score by Dan Olsen
When thinking about value for the customers, we’d like to understand:
How well is the customer’s need served today?
What is the opportunity to create new value by addressing that need?
How much value did you actually create?
In his book, The Lean Product Playbook, Dan Olsen suggests a brilliant way of answering these questions.
You start by asking the customer about the importance and satisfaction with the ability to achieve specific outcomes. For example, you can ask:
Importance: When using [Solution], how important is it for you to be able to [Outcome]? (For example, 1 to 5 scale, 1 = “Not at all important”, 5 = “Extremely important”)
Satisfaction: When using [Solution], how satisfied are you with your ability to achieve [Outcome]? (For example, 1 to 5 scale, 1 = “Not at all satisfied”, 5 = “Extremely satisfied”)
Next, we map the answers to a scale of 0 to 1.
How well is the customer’s need served today?
The assumptions are simple:
The more important an outcome is for the customer, the more value they get.
The more satisfied a customer is, the more value they get.
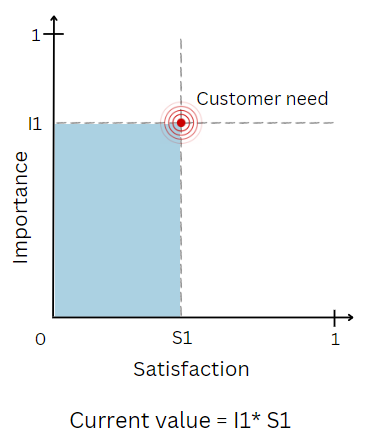
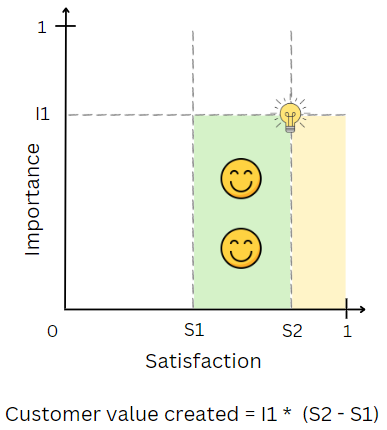
The current value the customer gets can be represented as a blue area below:
What is the opportunity to create new value by addressing that need?
The assumptions are simple:
The more important an outcome is, the more value we can create.
The less satisfied a customer is, the more value we can create.
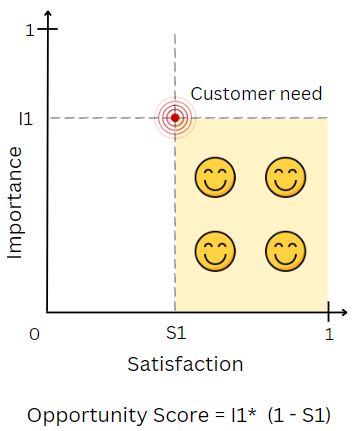
This potential value, known as the Opportunity Score, can be represented as the yellow area below:
How much value did you actually create?
The value created after the release can be represented as a green area below:
Opportunity Score By Dan Olsen
What I love about Dan’s approach is that it’s simple, easy to understand, and intuitive.
Opportunity Score = Importance * (1 - Satisfaction)
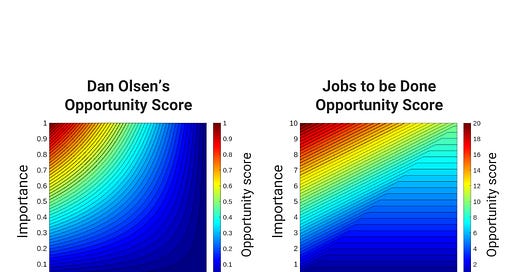
Dan has also shared an official template to visualize what is the Opportunity Score for different parameters:
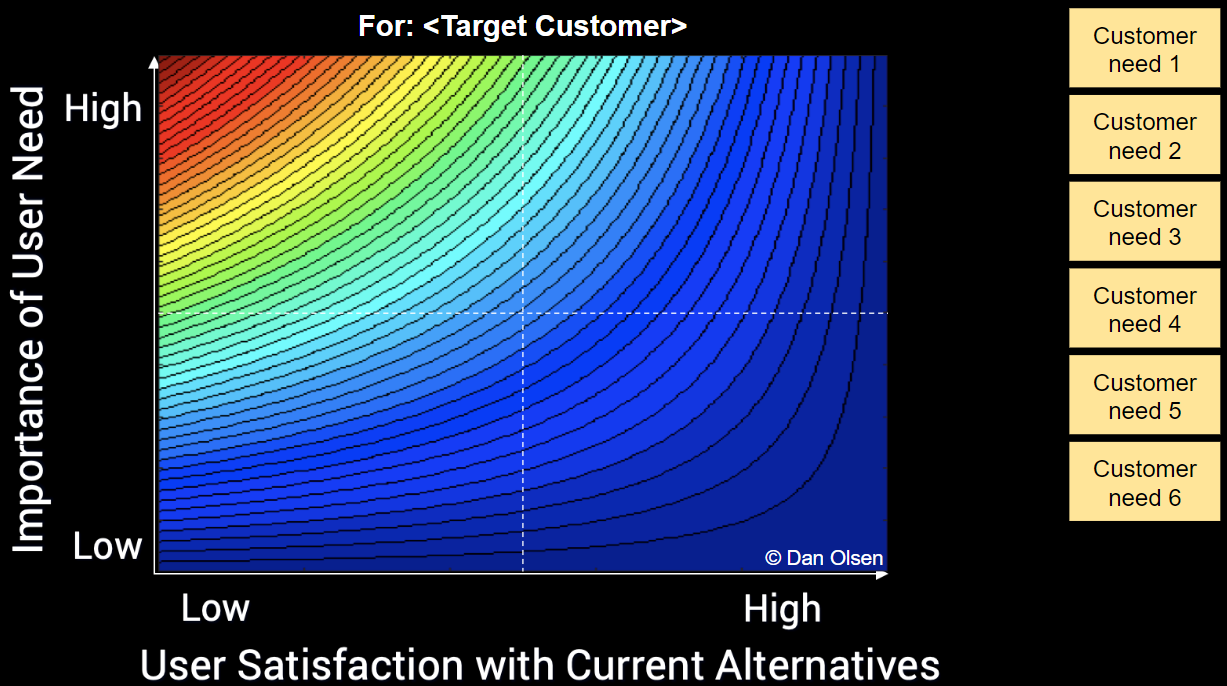
Opportunity Score from Jobs to be Done
An alternative Opportunity Score from Jobs to be Done can be expressed like this:
Opportunity Score = Importance + MAX(Importance - Satisfaction, 0)
You should ask customers two questions:
Importance: When [job step], how important is it to you that you are able to [outcome]? (1 to 5 scale, 1 = “Not at all important”, 5 = “Extremely important”)
Satisfaction: When using [solution], how satisfied are you with your ability to [outcome]? (1 to 5 scale, 1 = “Not at all satisfied”, 5 = “Extremely satisfied”)
Opportunity Score from Jobs to be Done has been validated in practice and can answer the question, “What is the opportunity to create new value by addressing a customer need?”
The results are often visualized as, though, as we’ll later see, it’s easy to misinterpret:
Selected rules for the underserved needs, based on the Jobs-to-be-Done book:
Opportunity scores greater than 15 represent extreme opportunities
Opportunity scores greater than 12 represent high opportunities
Opportunity scores greater than 10 represent solid opportunities
Opportunity scores <= 10 are appropriately served or overserved
Importantly, those scores are not calculated for a single customer. Instead, we consider the percentage of customers who answered 4 or 5 for each question. The results are mapped on a 0 to 10 scale, where 10 = 100%. But as we later try to identify customer clusters and repeat the calculations within a cluster, it doesn’t impact comparing the two approaches much.
You can read a detailed explanation, download editable templates, and see how to work with Jobs to Be Done step-by-step in my previous post, Jobs-to-be-Done Masterclass with Tony Ulwick and Sabeen Sattar.
1.3 Opportunity Score by Dan Olsen vs. Opportunity Score from Jobs to be Done
You might think the two formulas differ significantly, but they yield similar results where it matters most: for underserved needs.
The new more detailed visualizations shared with us by Dan Olsen after publishing this post: 🙏
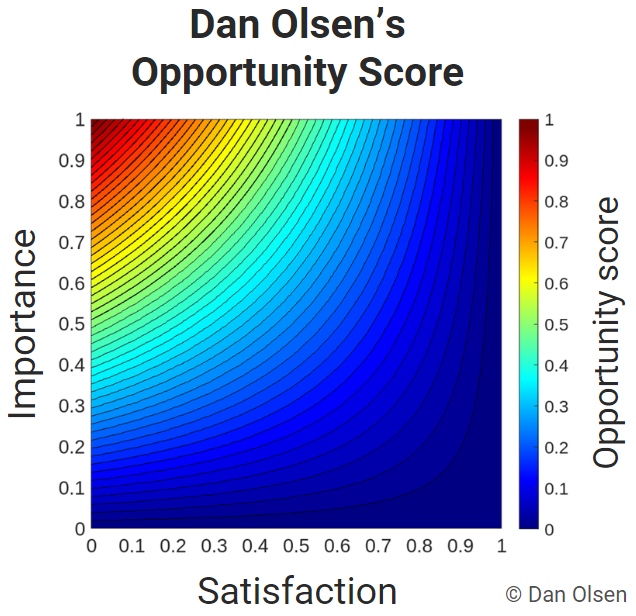
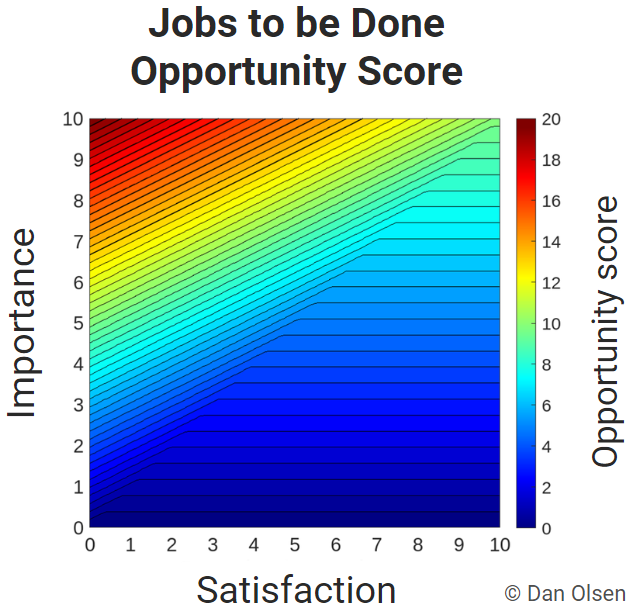
I usually use the first approach from The Lean Product Playbook, which is more intuitive and yields similar results where it matters the most.
2. How to Assess Value for the Business
We've explored customer value, but that's only half of the equation. As mentioned in From Goals to Ideas, every product serves two interconnected purposes:
Delivering value to the market (customers).
Capturing value for the business.
Customer value can protect revenue by reducing churn and potentially increasing revenue through higher acquisition or pricing.
But there's more to consider when assessing business value.
So, let's explore the complete picture.
Keep reading with a 7-day free trial
Subscribe to The Product Compass to keep reading this post and get 7 days of free access to the full post archives.

