Cohort Analysis 101: How to Reduce Churn and Make Better Product Decisions
Track user behavior over time, spot trends, and boost retention with targeted insights.
Cohort analysis is a powerful way to group users based on shared traits or behaviors and see how those groups behave over time.
For example, users who signed up in a specific month or completed a particular onboarding step. By tracking each cohort, you can identify where users drop off and take action to improve retention, reduce churn, and drive growth.
1. What Is Cohort Analysis?
Cohort analysis groups users by a shared characteristic, like their sign-up date or a key action. You then track how each cohort’s behavior changes over time.
For example, if you want to see why new users stop using your app after two weeks, you can analyze the “September 2025 Sign-Ups” cohort and see how their activity evolves day by day or week by week.
Why It Matters: It answers not just “What’s happening?” but “Who’s affected?” and “When did it start?” That’s far more actionable than a broad average that lumps everyone together.
2. Two Types of Cohorts a PM Should Know
There are two types of cohorts you can use in customer cohort analysis:
Acquisition Cohorts
Group users by the date they joined (e.g., all September sign-ups).
Helps you see if changes to onboarding or marketing in that period influenced retention or churn.
Behavioral Cohorts
Group users by in-app actions (e.g., completed onboarding, used a key feature).
Reveals which behaviors correlate with higher retention. For example, users who completed a setup checklist may churn less than those who skip it.
3. Netflix Case Study: The “Hooked Episode”
Background
In 2015, Netflix publicly shared that they analyzed when new viewers got “hooked” on a series, meaning the exact episode after which they would finish the entire season.
They discovered, for instance, that viewers who reached Episode 2 of Breaking Bad or Episode 3 of House of Cards were far more likely to keep watching. And stay subscribed.
How It Relates to Cohort Analysis
Let’s break it down:
Cohort Definition: One way to view this is to treat “people who started a new show” in a given month (or week) as a cohort.
Behavior Tracked: Netflix monitored how many episodes each user watched, grouping them by the specific show and episode at which they continued or dropped off.
Outcome: By comparing cohorts who made it to the “hooked episode” vs. those who didn’t, Netflix found that hitting that milestone correlated strongly with higher retention.
Action Taken: This insight influenced Netflix’s strategy:
Auto-Play: They refined the auto-play feature so users quickly move from one episode to the next, making it easier to reach that “hooked” threshold.
Personalized Recommendations: They promoted the next episode or similar shows more prominently to encourage continuous viewing.
Content Investment: They doubled down on producing or acquiring shows with strong “hooking” potential.
Results
Thanks to retention cohort analysis, Netflix ensured that users who reached the hooking episode had a significantly lower churn rate.
Netflix continued using these data-driven insights to refine how they present shows to new viewers, ultimately boosting overall retention and customer lifetime value (CLV).
4. How to Run a Cohort Analysis in Product Management
Cohort Analysis is relatively straightforward. Here are the basic steps:
Define Your Question: Are you investigating churn, feature adoption, or onboarding success?
Pick a Cohort Type: Time-based (acquisition) or action-based (behavioral).
Track Over Time: Use analytics tools (e.g., Mixpanel, Amplitude) or set up custom dashboards. Monitor how many users remain active or complete the next step each day, week, or month.
Identify Patterns: Look for significant drop-offs or sudden changes. Investigate if a new feature or marketing campaign correlates with those changes.
Take Action: Form a hypothesis, run experiments, and see if your cohorts improve. Repeat until you see sustained gains.
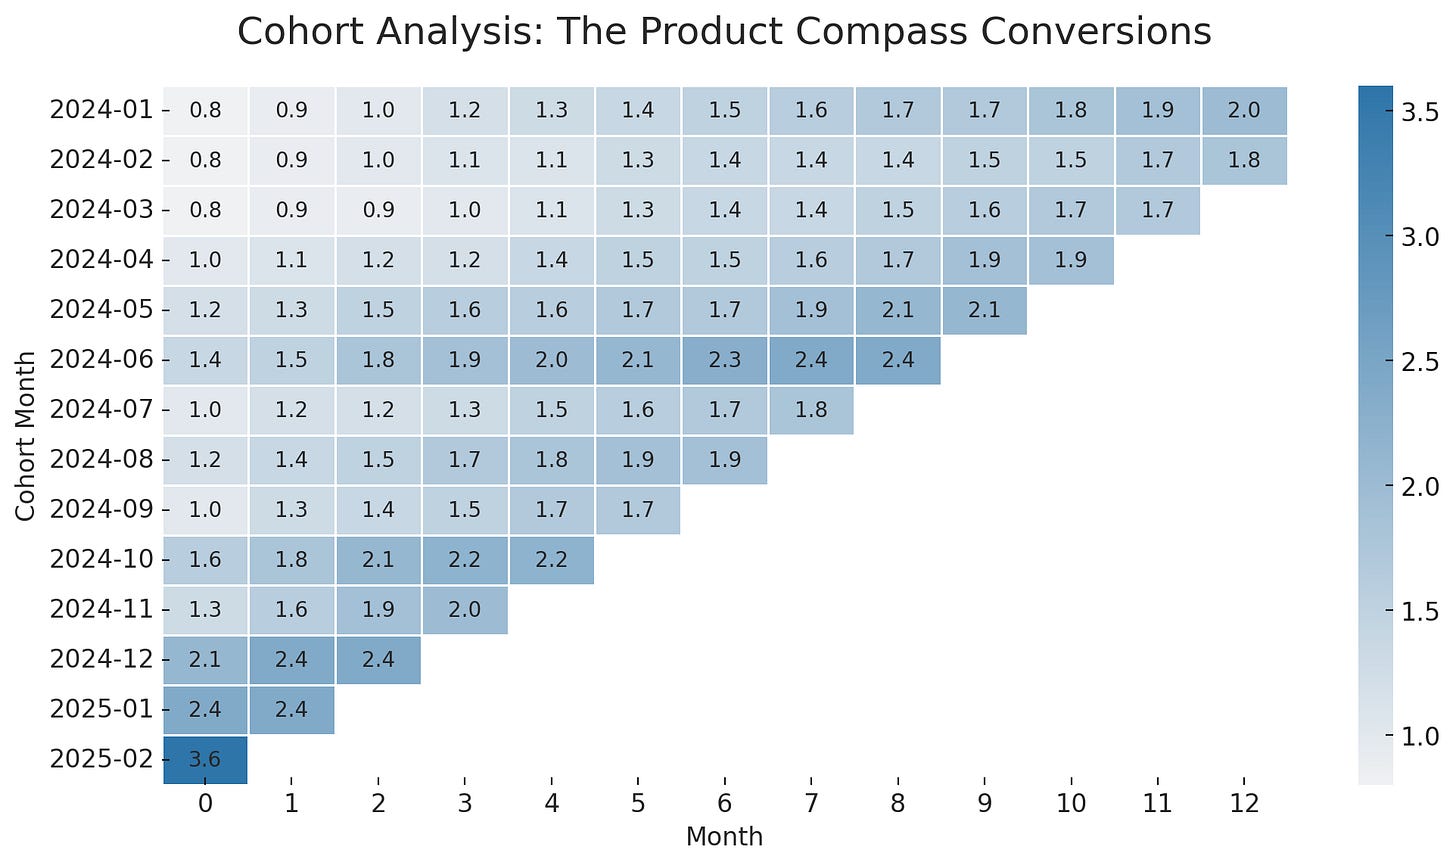
5. Cohort Analysis for The Product Compass Newsletter (real data)
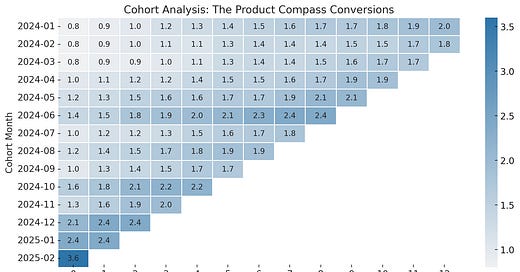
Here, you can see a real example of a cohort analysis for this newsletter:
Rows: Your subscription start date
Columns: How many readers turned into paid subscribers after x months (%)
I just realized we’ve never had such a massive conversion.
How to perform a similar cohort analysis with Excel and ChatGPT
Let’s take Substack as an example. To perform a similar cohort analysis, you can:
Export subscribers’ data to Excel, but only include what we need: Subscription type, Subscription date, and First payment at.
Remove the Email and Name columns if they are present. We don’t want to share this data.
Upload it to ChatGPT-4o. Prompt:
Think step-by-step to generate a cumulative cohort analysis table based on the attached Excel file.
Rows:
Represent the month when the subscription started (Subscription date), formatted as yyyy-mm.
Display only cohorts from 2024-01 to 2024-12, starting with 2024-01.
Columns:
Represent the number of months after the subscription started (First payment at - Subscription date in full months).
Include only months that have elapsed for each cohort.
Example: If today is 2024-06, then:
The 2024-01 cohort can have data for months 0 to 5,
The 2024-03 cohort can have data for months 0 to 3,
The 2024-06 cohort can only have data for month 0.
Any future months per cohort should be left empty dynamically.
Display only columns from 0 to 12.
Cells:
Contain the cumulative percentage of subscriptions that upgraded to a paid plan (Monthly Subscriber or Yearly Subscriber in Subscription type) in this month or earlier. This means that values in each row can only grow when moving to the right.
The percentage should be calculated relative to all subscriptions started in the given cohort month.
Leave cells empty (and not 0.0) if the cell is in the future. Today is 2/16/2025.
Round values to 2 decimal places.
Display a number corresponding to each cell, inside the cell, if not empty.
Visualization:
Apply a smooth gradient color from #FFFFFF (0) to #2e75a9 (max visible value in the table).
Ensure that each cohort only displays the months that have actually elapsed, forming a diagonal shape in the table.
6. Four Best Practices
When performing cohort analysis:
Prioritize Leading Indicators: If you see user complaints spike early, that might predict future churn.
Combine Qualitative Insights: Talk to users in the drop-off cohort. Surveys and interviews can tell you Why they’re leaving.
Avoid Vanity Metrics: A big user count doesn’t help if they don’t stick around. Cohort analysis emphasizes retention, which is more actionable.
Iterate Constantly: Cohorts can reveal new problems once you fix the old ones. Keep measuring and improving.
FAQ
Q: What’s the difference between cohort analysis and funnel analysis?
A: Funnel analysis shows how users move through specific steps (e.g., sign-up to purchase). Cohort analysis groups users by a shared trait over time.
In practice, they often work together. Use funnel analysis to find drop-offs in a process, then cohort analysis to see how different user groups behave.
Q: Should I start with acquisition or behavioral cohorts?
A: Acquisition cohorts are easier to start with (e.g., “all users who signed up in October”). Behavioral cohorts provide deeper insight into why users churn.
Many product teams use both.
Q: How do I pick the right time intervals?
A: If your product sees daily engagement (like a messaging app), track cohorts by day or week. For B2B SaaS with monthly plans, monthly intervals often make more sense.
Q: Can cohort analysis help with upsells?
A: That’s one of the core use-cases! By grouping users who upgraded or bought add-ons, you can see if certain behaviors (e.g., frequent feature usage) predict upsells. Then, optimize the journey for that behavior.
Q: What tools do I need?
A: Popular analytics platforms like Mixpanel, Amplitude, or Google Analytics can generate cohort reports. Data Analysts can build custom reports with Microsoft Business Intelligence, Google BigQuery (SQL-like), Tableau, or spreadsheets, though it may be more time-consuming.
Enjoy this?
You might also like:

