A/B Testing 101 + Examples
Why do we need A/B testing? What is A/B testing? How to plan an A/B test? A/B testing vs Multivariate testing.
Hey, Paweł here. Welcome to the archived version of The Product Compass!
Every week, I share actionable tips to boost your PM career. If you haven't already, join the community of 28,000+ readers by subscribing below.
If you are not a paid subscriber, here’s what you might have recently missed:
A/B Testing 101 + Examples
A/B testing is the most powerful tool product teams can use to improve their products continuously.
When used correctly, A/B testing can quickly transform:
Experimenting with new product ideas
Improving user flows and the onboarding process
Choosing the right product messaging (e.g., landing pages, emails)
Optimizing the AARRR funnel (e.g., bounce rate, conversion, CAC, revenue)
The idea is simple: compare 2 solutions (variants) to determine which performs better.
To illustrate how essential A/B testing is for successful tech products, let’s quote Mark Zuckerberg:
“At any given point in time, there isn’t just one version of Facebook running. There are probably 10,000.” - Mark Zuckerberg in his interview, quoted after dynamicyield.com
Unfortunately, there are two types of resources you'll likely find:
Simplistic ones that might lead you astray
Advanced ones with lots of math, statistics, and theory
In this issue, I simplify what you need to know to perform A/B testing without spending hours learning math and solving equations:
Why do we need A/B testing?
What exactly is an A/B test?
How to plan an A/B test?
🔒 How to perform an A/B test?
🔒 How to analyze the results of an A/B test?
🔒 Additional considerations
1. Why do we need A/B testing?
The two problems A/B testing is exceptionally good at solving are:
Confusing correlation with causation (spurious correlation)
Selection bias
Let's examine two examples to illustrate these points:
1.1 Example 1: Shark attacks
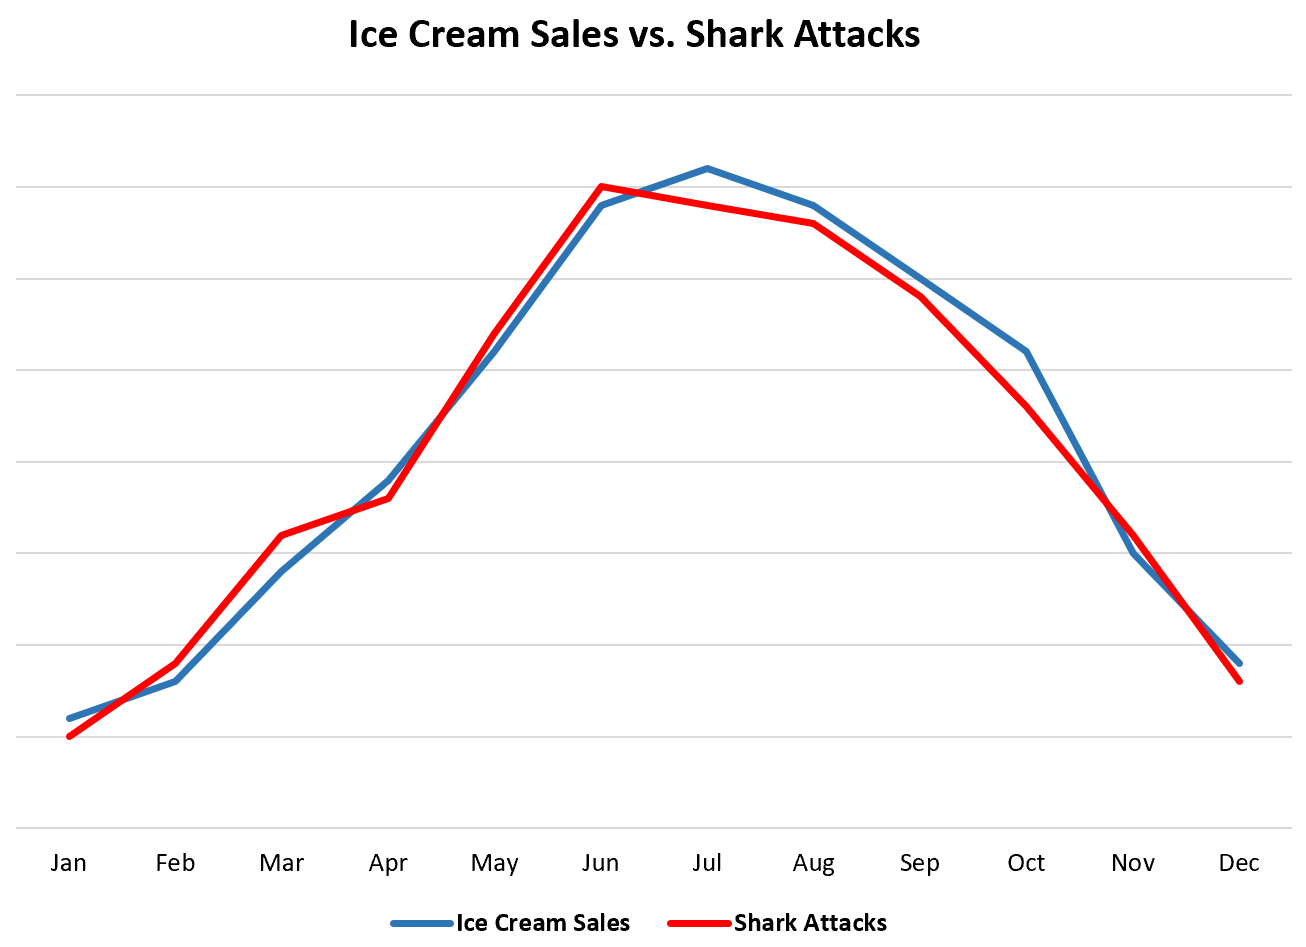
Below is data representing the monthly ice cream sales and monthly shark attacks across the United States each year:

At first glance, one might conclude that we should immediately halt the sale of ice cream to prevent shark attacks.
Sounds absurd, right?
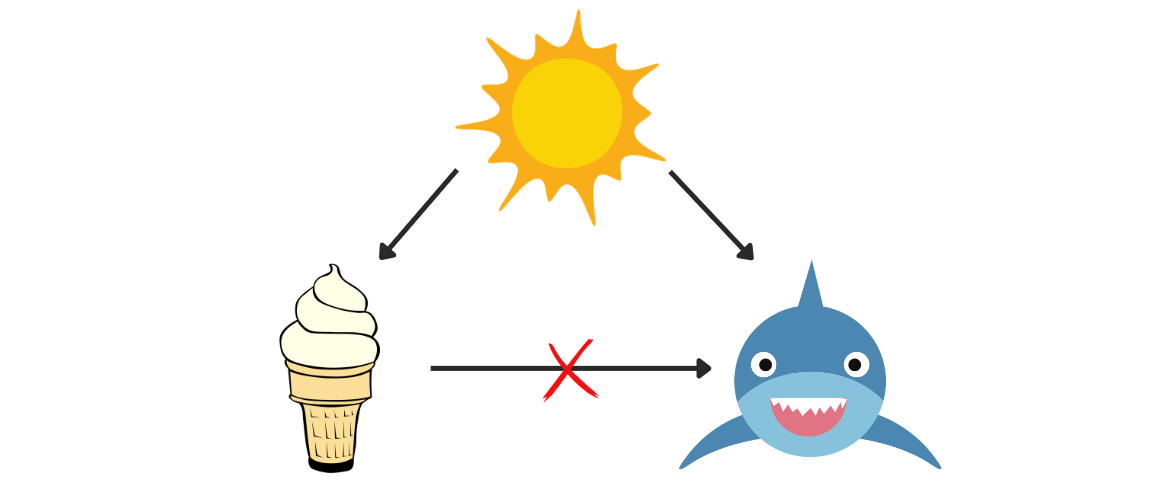
In the example above, there is a third variable, the weather, that influences both ice cream sales and shark attacks. While ice cream sales and shark attacks are correlated, one doesn’t cause the other.
This type of correlation caused by external factors is called spurious correlation. It’s extremely common in product management, but the variables at play might be non-obvious or impossible to establish.
After reading this issue, you'll understand how to pin down the causal relationships between variables. But for now, it's crucial to remember that:
Correlation doesn’t imply causation.
I sure wish politicians and journalists knew this too ;)
1.2 Example 2.1: An awesome red button ver. 1
Let's say you're looking to improve the conversion rate of your landing page, which currently stands at 20%:
You hypothesize that a “sign up” button isn’t good enough, so you decide to replace it with a red one:
The very next day, the conversion rate jumps to 30%.
Excited, you approach your manager to ask for a raise (because that's what a PM would do!).
But then she challenges you:
“How do you know the change was caused by the button? We just ran a marketing campaign. Could the conversion have increased even more if you did nothing?”
“You analyzed 100 visitors. How do you know it’s not just a random fluctuation? How significant is this result?”
(After reading this issue, you will know how to answer those questions.)
1.3 Example 2.2: An awesome red button ver. 2
You don’t give up and set up another experiment to demonstrate the efficacy of the awesome red button.
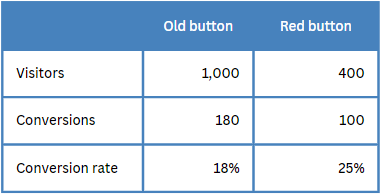
After a minor JavaScript tweak, the red button now only displays to customers using MacOS. You patiently gather more data. Two weeks later, it appears that the conversion rate with the red button far exceeds that of the old one:
Delighted, you begin to celebrate.
But then your colleague looks at historical data and notices that the conversion rate for MacOS users has always been high, 27% in the last month. Your red button has a slightly negative impact on conversions in this group.
What went wrong?
The two populations of users (MacOS users and users of other operating systems) were inherently different, each with unique behavioral patterns.
Selection bias arises when users are not selected randomly. It’s the primary reason why it might be so difficult to identify spurious correlations.
2. What exactly is an A/B test?
Let's begin with a definition:
A/B test involves randomly picking users to compare 2 solutions (variants) and determine which performs better.
In a traditional A/B test, one variant is the "control," where no change is applied. The other variant, the "treatment," introduces a new feature or change.
For example:
A new feature to improve the onboarding process:
Control: the existing onboarding process
Treatment: an onboarding process with a new feature
A change in the recommendations algorithm
Control: the old algorithm
Treatment: a new algorithm
A change on the product’s website:
Control: the old website
Treatment: a website with a new button
In this context, we also define:
Control group - a random group of users who don't experience the treatment
Treated group - a random group of users who receive the treatment
2.1 The importance of randomness in A/B testing
In the A/B test definition, I emphasized “randomly.” The populations on which you perform experiments must be as identical as possible.
Without randomness, there is no A/B testing. It's the only way to eliminate selection bias and consequently, spurious correlation.
Specifically, the following factors should not influence how you select users for your experiments:
Time (for instance, testing variant A one week and variant B the next)
People's characteristics and behaviors (e.g., grouping people based on location or age, comparing volunteers receiving a treatment vs. other users)
Later in this issue, I explain how to do it in practice.
2.2 Practical tips
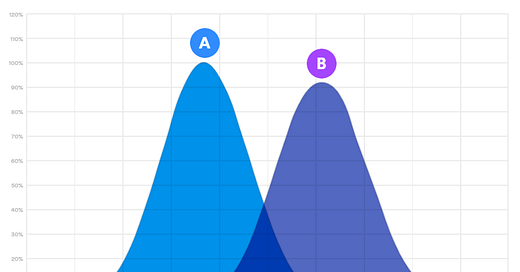
💡 Tip: You can use more than 2 variants. This is called "Multivariate Testing," where you have one control and multiple treatments:

I don't use this method often, as it increases complexity and reduces the amount of data you can collect for each variant. Instead, I prefer to gather data quickly and, if necessary, continue experimenting with additional variants. Your product and types of experiments might differ (e.g., millions of MAU), so consider your specific situation.
💡 Tip: Similar tools and techniques can be applied to compare new solutions without a control. Though it's not technically an A/B test, this approach can be particularly useful in marketing and product discovery, for example:
Comparing two prototypes to assess which one is more usable
Evaluating two versions of a new paid ad campaign to determine which yields better results
3. How to plan an A/B test?
Keep reading with a 7-day free trial
Subscribe to The Product Compass to keep reading this post and get 7 days of free access to the full post archives.


