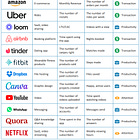
AARRR (Pirate) Metrics: The 5-Stage Framework for Growth
How to track and optimize user acquisition, activation, retention, revenue, and referral using Dave McClure’s AARRR framework.
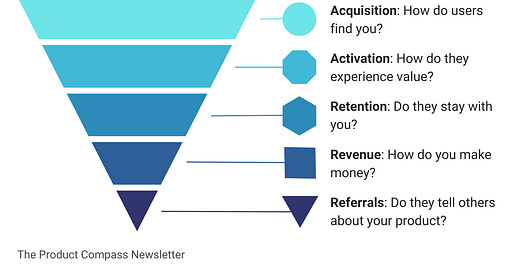
AARRR, also known as Pirate Metrics, stands for Acquisition, Activation, Retention, Revenue, and Referral. It’s a simple framework that covers every step of your growth funnel. These metrics can help you improve the user experience and optimize the customer lifecycle.
Below, we break down each stage with examples of key SaaS metrics.
Before we go further, I can't emphasize this enough: you can't track everything. Focus on a few key indicators that matter most for your product.
Now, let’s dive into the details.
1. Acquisition
Acquisition is how you attract new users or customers.
Key Metrics: Cost Per Acquisition (CPA), Customer Acquisition Cost (CAC), Bounce Rate, Click-Through Rate (CTR).
Example: If you run a language-learning app, track sign-ups from Facebook Ads. Check how many convert after seeing a paid ad. Compare that to sign-ups from your SEO blog posts. If ads cost more than the revenue from each new user, your CAC is too high.
My advice: focus on channels that attract the right audience, not just big numbers.
For example, I could cover popular and controversial topics on X, like politics, and link to this newsletter. But that wouldn’t help in selecting the right audience.
2. Activation
Activation happens when a user first realizes and engages with the core value of your product.
Key Metrics:
Time to Value (TTV),
Onboarding Completion Rate,
Trial-to-Paid Conversion,
User Activation Rate,
Feature Adoption Rate.
Example: For a B2B SaaS product, measure how quickly a new user reaches a key activation milestone, such as successfully integrating their CRM and seeing actionable insights. If 60% complete this step in the first week while 40% drop off, you may need to simplify the process or provide better guidance.
My advice: A smoother activation increases the likelihood of higher engagement and retention later.
3. Retention
Retention measures how many users continue engaging with your product's core value over time.
Key Metrics:
Churn Rate,
Retention Rate (1-day, 7-day, 30-day, etc.),
Cohort Retention (how different user groups retain over time),
User Renewal Rate (for subscriptions),
Feature Retention (do they keep using key features?).
Example: If 100 people sign up for your subscription-based fitness app in January, how many are still completing workouts by March? If 50 remain active, your two-month retention rate is 50%.
My advice: High retention usually means users consistently get value from your product. Instead of just short-term funnel hacking, focus on:
Delivering repeatable value tied to your North Star Metric (e.g., “workouts completed”).
Reducing friction to re-engage (e.g., quick-start workouts).
Features that help users track progress and stay motivated (e.g., progress dashboards, personalized reminders, or social sharing).
4. Revenue
Revenue measures how much money your product generates and how it scales over time.
Key Metrics:
Monthly Recurring Revenue (MRR),
Annual Recurring Revenue (ARR),
Customer Lifetime Value (LTV),
Expansion Revenue, MRR / ARR (recurring revenue growth),
LTV:CAC Ratio (sustainability of revenue),
Expansion Revenue (upsells, cross-sells),
Revenue Churn (lost revenue from cancellations).
Example: If you run a SaaS with tiered plans, track how many users upgrade, downgrade, or cancel each month. If your MRR is $10,000 in one month and $12,000 the next, you've added $2,000 in net MRR. But, if high-value accounts churn, your net revenue could shrink despite new upgrades.
My advice: Balance top-line revenue with costs so you don’t overspend on acquisition. While we often simplify metrics, the ultimate goal is not just revenue but sustainable profitability.
5. Referral
Referral happens when existing users bring in new users, often through word-of-mouth or incentive programs.
Key Metrics:
Virality Coefficient (how many new users each existing user brings in),
Referral Conversion Rate (% of referred users who sign up),
Customer Referral Rate (% of existing users who refer others),
Some use NPS as a supporting metric, but it’s controversial. I prefer measuring actual customer behavior.
Example: Launch a referral program that rewards both the referrer and the new user, such as free credits. Track how many sign-ups come from shared links and whether those users become active. If your virality coefficient is above 1, your user base can grow exponentially without additional marketing costs.
My advice: Referrals can be a powerful, low-cost growth channel, especially for products with built-in network effects. But they are challenging. You need to offer clear, must-have value that makes users want to share.
A great referral strategy makes the product itself more useful when shared (e.g., Dropbox's extra storage for referrals) or provides strong incentives to spread the word.
Keep It Simple
You can’t track every metric. Focus on just a few that align with your North Star Metric, strategy, or objectives.
FAQ
Q: What does AARRR stand for?
A: It stands for Acquisition, Activation, Retention, Revenue, and Referral. These five stages cover your entire growth funnel.
Q: Why is it called Pirate Metrics?
A: Because saying the letters A-A-R-R-R sounds like a pirate’s “Arrr.”
Q: Who created the AARRR framework?
A: Dave McClure, an investor and entrepreneur, popularized it to help startups focus on the entire user journey.
Q: How do I start measuring AARRR metrics?
A: You can’t track everything. Start with just a few of the most impactful metrics. For instance, if churn is high, focus on retention strategies before scaling acquisition.
I also recommend you read Are You Tracking the Right Metrics. For example, track changes over time and look at ratios (e.g., conversion rate) rather than raw numbers.
Q: How do I choose which metric to focus on first?
A: Identify your biggest problem or opportunity. For example, if you’re losing users right after sign-up, focus on Activation. If you’re not generating enough revenue, focus on Revenue.
Q: Should I track every sub-metric in each stage?
A: Pick no more than just 2-3 key metrics in each stage (if any). You can analyze more metrics “ad hoc” as you grow.
Q: What if I don’t have enough data?
A: Start small. Track basic metrics and pair them with qualitative insights (user interviews, surveys). As your user base grows, expand your analytics.
Liked this?
You might also enjoy:

