The Ultimate List of Product Metrics
An extended edition: Acquisition, Activation, Engagement, Retention, Revenue, Referral, and Lean and Agile metrics. Additional techniques, and resources.
Welcome to the free archived edition of The Product Compass.
Subscribe now and upgrade your account, if you haven’t already, for the full experience:
This post was updated on November 4, 2024
The Ultimate List of Product Metrics
In Today’s newsletter:
Acquisition Product Metrics
Activation Product Metrics
Engagement Product Metrics
Retention Product Metrics
Revenue Product Metrics
Referral Product Metrics
Lean and Agile Metrics
Conclusions, additional techniques, and resources
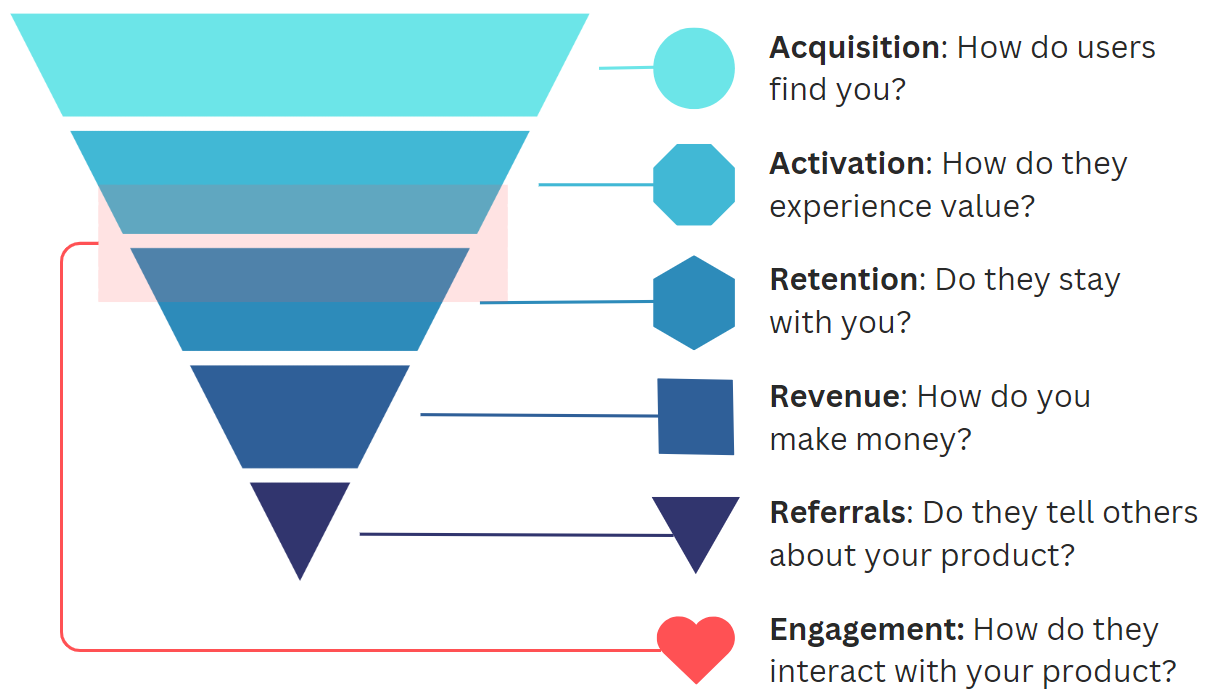
The classification below is based primarily on the AARRR (Acquisition, Activation, Retention, Revenue, Referral) framework, which is universal and fits every organization that works on customer-facing tech products.
On top of that, I added two categories:
Engagement Metrics: I want to emphasize the distinct metrics focusing on user interaction with the product. More in the 3rd point.
Lean and Agile Metrics: Metrics related to the effectiveness of delivering value. Some of them, like Time to Market (TTM) or Time to Learn (TTL), are essential to succeed by quickly adapting to the changing market conditions.
Without further ado:
1. Acquisition Product Metrics
How do users find you?
Bounce Rate
The percentage of visitors who leave your website after viewing just one page. A high bounce rate may indicate issues with the landing page (e.g., messaging) or targeting.
Conversion Rate
The percentage of users who take a desired action, like signing up for a newsletter.
Landing Page Conversion Rate
The percentage of visitors who take a desired action on a specific landing page, like signing up or starting a trial, on a specific landing page.
Customer Acquisition Cost (CAC)
The cost of acquiring a new customer through marketing and sales efforts.
Cost Per Acquisition (CPA)
Similar to CAC, but can encompass costs for acquiring any desired action, not just paying customers.
Channel Effectiveness
The success of each acquisition channel in driving traffic, sign-ups, or purchases.
Traffic Source Distribution
The breakdown of incoming user traffic by different sources, such as organic search, referrals, or paid ads.
Cost Per Click (CPC)
The cost for each click on your ads. It helps you understand the cost-effectiveness of your advertising campaigns.
Click-Through Rate
The percentage of people who click on your ad after seeing it. A higher CTR indicates more effective ads.
2. Activation Product Metrics
How do they experience value?
Time to Value (TTV)
The time it takes for a user to experience the core benefits of your product after starting to use it.
A shorter TTV leads to higher user satisfaction, engagement, and retention. In product-led growth, optimizing TTV is crucial to ensure users quickly understand the value your product delivers.
Onboarding Completion Rate
The percentage of users who complete the onboarding process successfully.
User Activation Rate
The percentage of users who successfully complete a certain milestone in your onboarding process.
Trial-to-Paid Conversion Rate
The percentage of trial users who convert into paying customers.
First-time User Conversion Rate
The percentage of first-time users who complete a desired action, such as creating an account or purchasing. This metric helps assess the effectiveness of the onboarding process.
Product Qualified Leads (PQL)
Individuals within your user base who have shown strong intent to purchase, often through specific product usage patterns.
Product Qualified Accounts (PQA)
Entire accounts (especially relevant in B2B contexts) where multiple users within the same organization have collectively shown buying intent through product engagement.
3. Engagement Product Metrics
How do they interact with your product?
Engagement Metrics can be considered part of the Retention and, depending on the context, Activation (e.g., Session Length). I presented them as a separate category to emphasize the distinct metrics focusing on user interaction with the product.
Daily Active Users (DAU)
The number of unique users who engage with the product daily.
Monthly Active Users (MAU)
The number of unique users who engage with the product monthly.
Stickiness
The ratio of daily active users (DAU) to monthly active users (MAU), which indicates how often users engage with the product.
User Satisfaction (CSAT)
A measure of how satisfied users are with the product, often determined through surveys or in-app feedback (e.g., Pendo, Gainsight).
Keep reading with a 7-day free trial
Subscribe to The Product Compass to keep reading this post and get 7 days of free access to the full post archives.


